

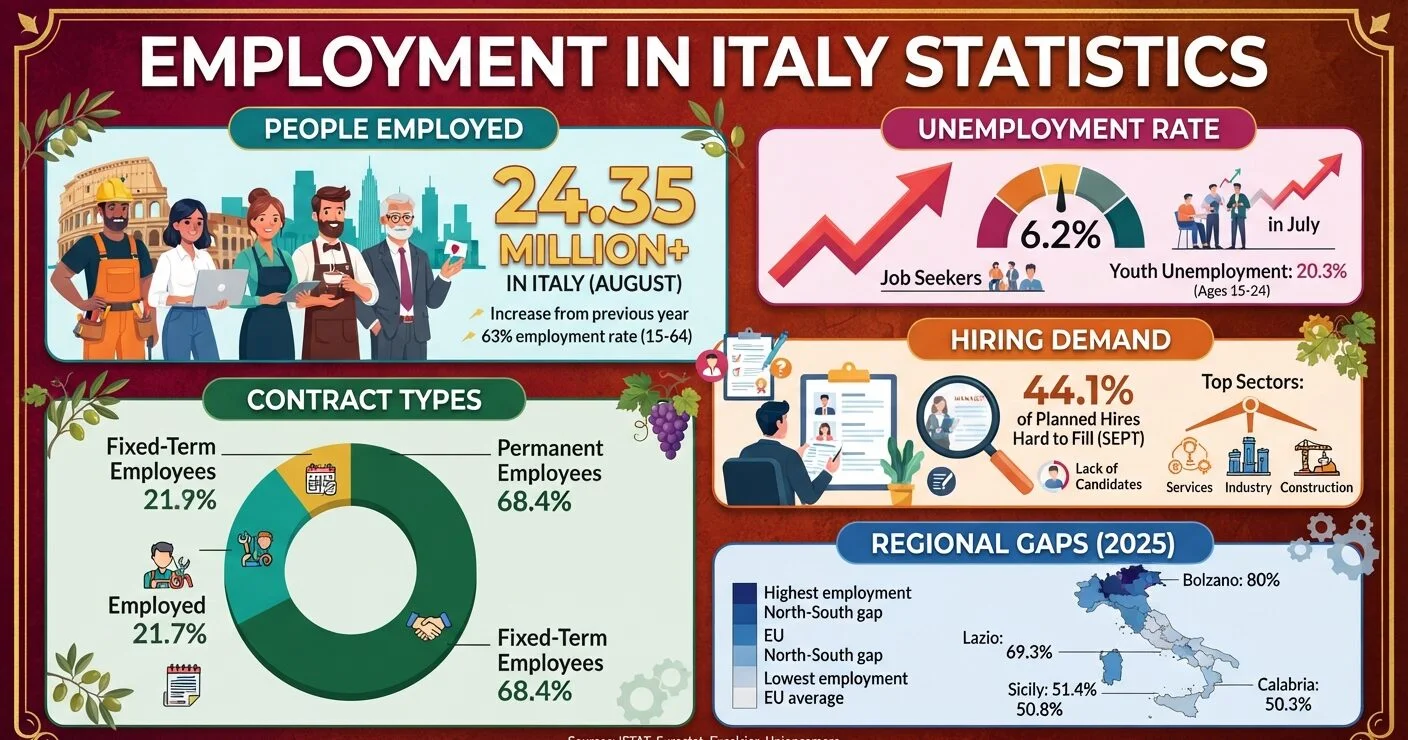
Italy had 24,352,000 people in work in August 2026, 291,000 more than in August 2025, while the unemployment rate climbed to 6.2%, according to ISTAT’s provisional estimate.
These employment in Italy statistics track the latest monthly release, contract and age splits, Italy’s EU and regional gaps, business hiring plans and contractual wages.
Employment in Italy Statistics
How Many People Are Employed in Italy in 2026?
ISTAT counted 24,352,000 employed people in August 2026. That is 5,000 fewer than in July, which ISTAT classes as stable, and 291,000 more than a year earlier.
The employment rate for ages 15 to 64 stood at 63.0%, down 0.1 points on the month and up 0.6 points on the year. The inactivity rate fell to 32.7%.
June to August 2026 added 40,000 jobs compared with March to May 2026, a 0.2% rise.
| Group | August 2026 | Change vs July 2026 | Change vs August 2025 |
|---|---|---|---|
| Employed | 24,352,000 | −5,000 | +291,000 |
| Unemployed | 1,591,000 | +48,000 | +129,000 |
| Inactive (15–64) | 12,124,000 | −21,000 | −381,000 |
Source: ISTAT, Occupati e disoccupati, August 2026 (provisional, seasonally adjusted)
Italy’s Unemployment Rate Rose to 6.2% in August 2026
The rate bottomed at 5.5% in January 2026 in ISTAT’s current series. It held at 5.6% from February to May, then rose to 6.0% in June and July and 6.2% in August.
ISTAT re-estimates its seasonally adjusted series every month. The values above come from the release published on 1 October 2026.
Job seekers rose by 48,000 in August, a 3.1% increase that covered men, women and every age group. Youth unemployment for ages 15 to 24 reached 20.3%, up 0.6 points.
Source: ISTAT, Occupati e disoccupati, January 2025–August 2026 series (seasonally adjusted, published 1 October 2026)
Employment in Italy Statistics by Contract Type
Permanent employees rose by 370,000 between August 2025 and August 2026. Fixed-term employees fell by 157,000 over the same period.
| Type of worker | August 2026 | Change vs August 2025 | % change |
|---|---|---|---|
| Permanent employees | 16,669,000 | +370,000 | +2.3% |
| Fixed-term employees | 2,391,000 | −157,000 | −6.2% |
| Self-employed | 5,292,000 | +78,000 | +1.5% |
| Total employed | 24,352,000 | +291,000 | +1.2% |
Source: ISTAT, Occupati e disoccupati, August 2026 (provisional, seasonally adjusted)
August alone showed the same split. Permanent employees grew by 48,000, while fixed-term employees fell by 48,000 and the self-employed by 5,000.
ISTAT’s self-employed group covers entrepreneurs, freelance professionals, own-account workers, unpaid family helpers, cooperative members and collaborators. Independent work in other markets is covered in these freelancer statistics.
Which Age Groups Added Jobs in the Past Year?
Workers aged 50 and over added 367,000 jobs between August 2025 and August 2026, a 3.6% rise. The 35–49 group lost 122,000.
| Age group | Employed, August 2026 | Change vs August 2025 |
|---|---|---|
| 15–24 | 997,000 | −7,000 |
| 25–34 | 4,272,000 | +53,000 |
| 35–49 | 8,563,000 | −122,000 |
| 50 and over | 10,520,000 | +367,000 |
ISTAT also publishes yearly changes net of population shifts. On that basis, employment among 35–49-year-olds rose 0.6% instead of falling 1.4%, and the 50–64 gain narrows from 2.5% to 1.8%.
Unemployment among 25–34-year-olds jumped 22.7% in a year to 461,000. Their unemployment rate reached 9.7%.
Employment rates in August 2026 were 17.0% for ages 15–24, 69.1% for 25–34, 77.9% for 35–49 and 68.0% for 50–64.
Source: ISTAT, Occupati e disoccupati, August 2026 (provisional; age tables seasonally adjusted)
Italy Employment Statistics vs the EU: Last Place at 67.6% in 2025
Eurostat put Italy’s 2025 employment rate for people aged 20 to 64 at 67.6%, the lowest of the 27 member states. The EU average reached 76.1%, its highest since the series began in 2009.
Malta led at 83.6%, ahead of the Netherlands at 83.4%, a market covered in our employment in the Netherlands statistics. Romania (69.0%) and Greece (71.0%) joined Italy at the bottom.
Italian women had a 58.0% employment rate in 2025, against 71.3% across the EU. Italy’s gender gap of 19.1 points was the widest in the EU; the EU gap was 9.6 points.
Source: Eurostat, EU labour force survey annual data, 2025 (published 17 April 2026)
Gender Gap in the August 2026 Monthly Data
ISTAT’s monthly figures for ages 15 to 64 show a 71.6% employment rate for men and 54.3% for women. Women’s unemployment rate was 6.8%, against 5.7% for men.
Women accounted for 134,000 of the 291,000 jobs added between August 2025 and August 2026.
Source: ISTAT, Occupati e disoccupati, August 2026 (provisional, seasonally adjusted)
Where Is Employment in Italy Lowest?
| Region or area | Employment rate, ages 20–64, 2025 |
|---|---|
| Bolzano (autonomous province) | 80% |
| EU average | 76.1% |
| Lazio | 69.3% |
| Sicily | 51.4% |
| Campania | 50.8% |
| Calabria | 50.3% |
Calabria, Campania and Sicily recorded the lowest regional employment rates in the EU in 2025, alongside the French outermost regions of Mayotte and French Guiana. Eleven Italian regions fell below 74%.
Italy’s coefficient of variation for regional employment rates was 15.1% in 2025, the widest in the EU. Romania (8%), Belgium (7.9%) and Spain (6.1%) followed, and Spain’s regional split is set out in these employment in Spain statistics.
Campania and Sicily also posted unemployment rates above 12% in 2025. In Molise, 70.1% of the unemployed had been out of work for at least a year.
Source: Eurostat regional labour market statistics, 2025, as reported by Il Sole 24 Ore (24 September 2026)
A year earlier, Eurostat gave Italy a coefficient of 15.6%, with Bolzano at 79.9%, Calabria at 48.5% and Campania at 49.4%.
Source: Eurostat, Regional yearbook 2025, 2024 data
Firms Expect Trouble Filling 44.1% of September Hires
Excelsior’s September 2026 survey of about 100,000 firms counted 565,000 planned hires for the month and 1.5 million for September to November. Monthly demand was 0.6% below September 2025.
Lack of candidates was the main reason firms gave for hiring difficulty. Mismatch reached 73.3% for life science specialists and 63.5% for engineering technicians.
Services account for 65.6% of planned hires, industry including construction for 26.5% and the primary sector for 7.9%. Only 22% come with a permanent or apprenticeship contract.
Under-30s are sought for 27.6% of planned hires and foreign workers for 23%. Lombardy (114,480), Lazio (58,790) and Veneto (51,610) lead by region.
| Month (2026) | Planned hires, rounded as published |
|---|---|
| January | 527,000 |
| February | 424,000 |
| March | 479,000 |
| April | 500,000 |
| May | 544,000 |
| June | 623,000 |
| July | 568,000 |
| September | 565,000 |
Source: Unioncamere and Ministry of Labour, Excelsior monthly releases, January–September 2026 (August not listed in Excelsior’s news archive)
Job Vacancy Rate in Q2 2026
ISTAT’s preliminary estimate puts the vacancy rate for all firms with employees at 1.5% in Q2 2026, down 0.1 points on Q1. Services fell 0.2 points to 1.5%, while industry held at 1.5%.
Firms with at least 10 employees reported 1.3%. Vacancy levels in another large European market appear in these UK employment statistics.
Source: ISTAT, Posti vacanti nelle imprese dell’industria e dei servizi, preliminary estimates, Q2 2026
Is Pay Keeping Up With Prices in Italy?
ISTAT’s hourly contractual wage index rose 2.4% between June 2025 and June 2026. After ten straight quarters in which contractual pay growth beat inflation, ISTAT reported that run reversed in Q2 2026.
Agriculture led at 3.2%, followed by industry at 2.7%, public administration at 2.3% and private services at 2.2%. Average hourly contractual pay for January–June 2026 was 2.6% above the same period of 2025.
At the end of June 2026, 50 national agreements were in force, covering 69.9% of employees, or about 9.1 million. Every public administration contract had expired.
Another 25 agreements awaited renewal, covering about 3.9 million employees, 2.8 million of them in public administration. Rules on pay disclosure across Europe are tracked in these salary transparency statistics.
The average wait for workers on expired contracts fell from 24.9 months to 17.9 months between June 2025 and June 2026.
Source: ISTAT, Contratti collettivi e retribuzioni contrattuali, April–June 2026 (published 29 July 2026)
FAQs
What is the employment rate in Italy?
63.0% of people aged 15 to 64 were employed in August 2026, per ISTAT. Eurostat’s 20–64 measure put Italy at 67.6% for 2025, the lowest rate in the EU.
What is Italy’s unemployment rate in 2026?
Italy’s unemployment rate was 6.2% in August 2026, up 0.2 points on July, per ISTAT’s provisional data. Youth unemployment (ages 15–24) reached 20.3%, and 1,591,000 people were looking for work.
How many people work in Italy?
24,352,000 people were employed in August 2026. ISTAT counts 16,669,000 permanent employees, 2,391,000 fixed-term employees and 5,292,000 self-employed workers.
Why does Italy have the lowest employment rate in the EU?
Eurostat’s 2025 figures show the shortfall concentrated among women and in the south. Italian women aged 20 to 64 had a 58.0% employment rate against 71.3% EU-wide, and Calabria recorded 50.3%.
Reddit users often say Italy has no jobs. What does the data show?
Not entirely accurate. Italy added 291,000 employed people between August 2025 and August 2026, and firms planned about 565,000 hires for September 2026. Calabria, Campania and Sicily still had 2025 employment rates of 50.3% to 51.4%.
Sources
https://www.istat.it/comunicato-stampa/occupati-e-disoccupati-dati-provvisori-agosto-2026/
https://ec.europa.eu/eurostat/en/web/products-eurostat-news/w/ddn-20260417-1
https://www.istat.it/comunicato-stampa/retribuzioni-contrattuali-aprile-giugno-2026/
