

Nvidia closed fiscal 2026 with roughly $5.1 million in revenue for every person on its payroll. Walmart, in a fiscal year that ended six days later, brought in about $340,000 per associate. That’s a 15x gap between two enormously successful companies, and it tells you almost nothing about which one is better run.
Revenue per employee is the easiest workforce metric to calculate and one of the easiest to misread. Divide annual revenue by headcount, and the result looks like a productivity score. It isn’t.
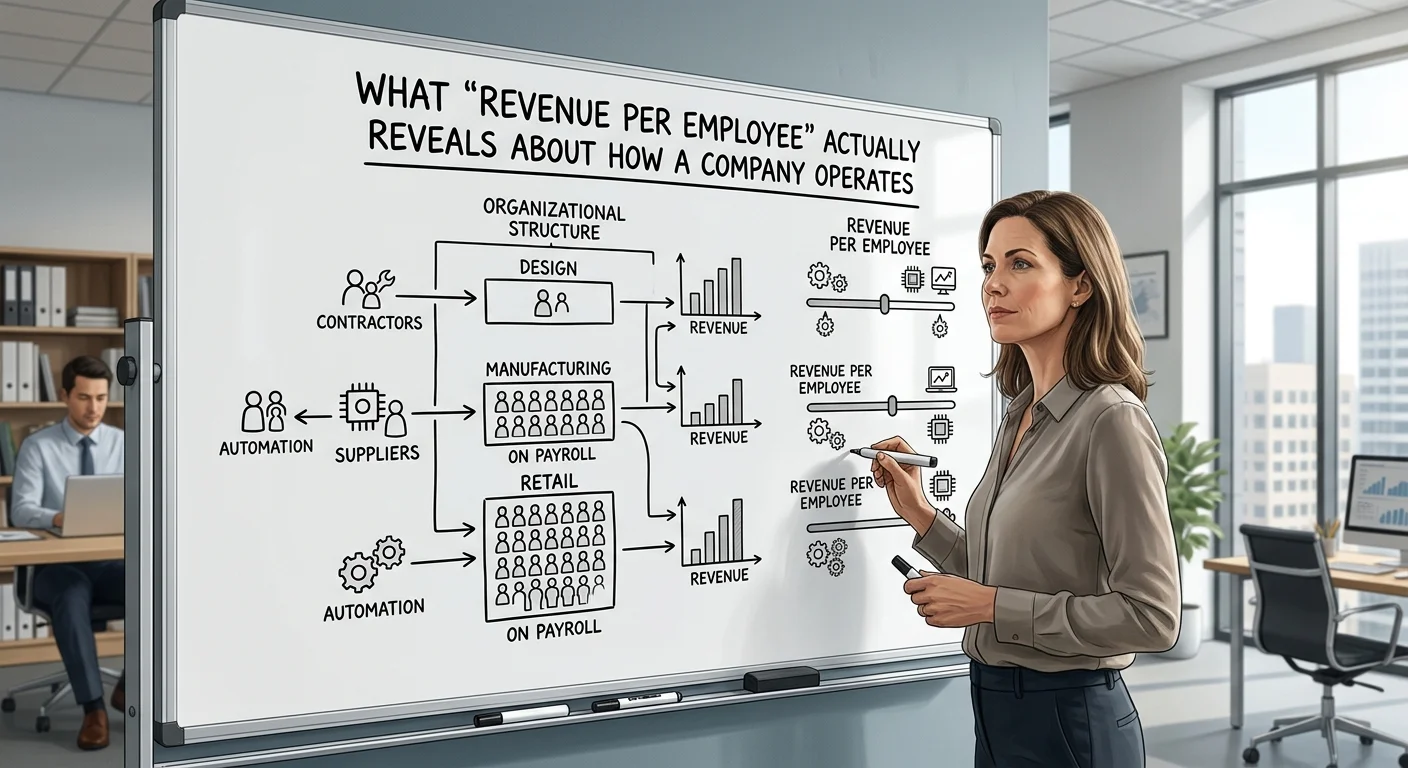
What the number actually describes is the shape of a company: how much of the work sits inside the payroll, how much machinery and software stand in for people, and how much of the daily operation runs without anyone touching it.
Five Companies, One Formula, Very Different Answers
Here’s what the math produces when you run it across five household names, using each company’s own reported revenue and headcount from its most recent annual filing.
| Company | Fiscal year ended | Revenue | Employees | Revenue per employee |
| Nvidia | Jan 25, 2026 | $215.9B | ~42,000 | ~$5.14M |
| Apple | Sep 27, 2025 | $416B | ~166,000 | ~$2.51M |
| Costco | Aug 31, 2025 | $275.2B | ~341,000 | ~$807K |
| Intel | Dec 27, 2025 | $52.9B | 85,100 | ~$622K |
| Walmart | Jan 31, 2026 | $713.2B | ~2,100,000 | ~$340K |
Nvidia’s figure comes from a year in which it reported $215.9 billion in revenue, up 65%, against a headcount of roughly 42,000 people across 38 countries.
Apple’s fiscal 2025 10-K reports about 166,000 full-time equivalent employees against $416 billion in revenue. Costco’s fiscal 2025 filing puts headcount at 341,000 against $275.2 billion.
Look at the ordering and the pattern is obvious: it tracks what each company employs people to do, not how hard those people work.
Nvidia designs chips and pays contract foundries to manufacture them, so the tens of thousands of people running fabrication lines sit on someone else’s payroll.
Apple sells hardware assembled by contract manufacturers. Costco and Walmart employ the people who unload trucks, stock shelves, and run registers, because that labor is inseparable from the product they sell.
Same formula, five different operating models, five wildly different answers. The metric isn’t broken. It’s just answering a question about structure that most people think is a question about effort.
What Actually Moves the Number?
Strip away the noise and four structural choices explain most of the variation between companies.
- What you employ versus what you buy. Every function a company outsources leaves the denominator while its output stays in the numerator. A firm that moves its customer support to a contracted provider watches revenue per employee rise the following quarter without a single customer being served differently. Nothing about the company got more productive. The org chart got shorter.
- How much capital stands in for labor. Capital-intensive businesses substitute equipment for headcount. A refinery, a data center, and a semiconductor fab all move enormous revenue with small on-site teams because the assets do the work. The tradeoff is that those companies carry the cost in depreciation instead of wages, which is why revenue per employee can look excellent at a business that isn’t especially profitable.
- Where you sit in the value chain. Design and licensing sit at the high end. Distribution, assembly, and retail sit at the low end. This isn’t a ranking of quality; a company that sells $713 billion of goods at retail margins is doing something structurally different from one selling design IP.
- How much manual operational work has been automated. This is the factor most people skip, and it’s the one that actually shows up in mid-size companies. Consider two distributors of similar size. One runs cycle counts on clipboards, reorders from a spreadsheet somebody maintains by hand, and keeps three people permanently occupied reconciling what the system says against what’s on the shelf. The other has pushed that same work into ERP inventory management, where stock levels, reorder points, and multi-location transfers update themselves and the remaining staff handle exceptions rather than counts. The second company needs fewer people to move the same volume of goods, which shows up as a higher revenue-per-employee figure.
Keep that one in proportion. For Nvidia, the inventory-operations headcount is a rounding error against 42,000 people.
For a 300-person distributor or manufacturer, it’s a measurable slice of the payroll, and automating it moves the number in a way you can actually see year over year.
The metric rewards it because the metric is counting bodies, and the work went somewhere those bodies weren’t needed.
Where the Number Lies to You?
Before comparing two companies on revenue per employee, check what’s actually in each half of the fraction. The failure modes are consistent:
- The denominator isn’t standardized. Some companies report full-time equivalents, some report total headcount, and most exclude contractors, seasonal staff, and agency workers entirely. A company running 20% of its labor through contracts looks leaner than an identical company that hired those people directly.
- The numerator ignores margin. Walmart’s fiscal 2026 filing shows $713.2 billion in total revenue and $21.9 billion in net income attributable to Walmart. Revenue per employee counts the first number and is blind to the second. A reseller booking gross transaction value will always outrank a business earning a commission on the same goods.
- Fiscal calendars don’t line up. Four of the five companies above closed their years in four different months. Comparing a January-ending year against an August-ending one during a volatile stretch compares two different economies.
- Acquisitions distort both halves at once. Buy a company and revenue and headcount both jump, usually not in the same proportion, and the trend line breaks in a way that has nothing to do with operations.
None of this makes the metric useless. It makes it a within-industry, over-time metric rather than a cross-industry leaderboard.
A Rising Number Isn’t Always Good News
Intel is the clearest recent case. The company reported full-year 2025 revenue of $52.9 billion, roughly flat year over year, and 85,100 employees as of December 27, 2025, down from 108,900 twelve months earlier.
Revenue held still while headcount fell about 21.9%. Run the arithmetic and revenue per employee jumped roughly 28% in a single year.
By the metric alone, Intel had a spectacular year of productivity gains. By any other reading, it shrank the denominator through restructuring while the numerator refused to grow.
That’s the whole trick: revenue per employee improves whether the top line rises or the payroll falls, and the two situations mean opposite things.
So always decompose the change before reacting to it. If revenue per employee climbed, ask which half moved. Revenue up and headcount flat means the operating model is scaling.
Revenue flat and headcount down means the company got smaller, and the metric is congratulating it for that. Revenue down and headcount down faster is a company managing a decline, which is sometimes the right call and never a productivity story.
How to Read It Without Fooling Yourself?
Revenue per employee earns its keep in a narrow set of uses. These are the ones that hold up:
- Compare within an industry, never across. A software company will always beat a grocer, and knowing that teaches you nothing. Ranking three grocers against each other tells you something real.
- Track the trajectory, not the level. One year’s figure is a snapshot of business model. Five years of the same figure shows whether the operating model is actually scaling.
- Always report the two inputs alongside it. Revenue and headcount, both years, so anyone reading can see which half moved.
- Pair it with a margin number. Revenue per employee plus operating margin catches the reseller distortion that either metric alone misses.
- Check the headcount definition before comparing. If one company counts contractors and the other doesn’t, you’re not looking at the same metric twice.
Used that way, the number becomes a decent early indicator. A company whose revenue per employee has been flat for four years while revenue grows is adding people in direct proportion to sales, which is a warning sign for anyone who expected the business to scale faster than its payroll.
A company whose figure climbs steadily while it keeps hiring has genuinely changed how the work gets done.
The same logic works in reverse when you’re evaluating an employer rather than an investment. A very high figure often means the company has concentrated its people in a narrow band of high-value roles and bought everything else, which shapes what career paths exist inside it.
A low figure in retail or logistics isn’t a red flag at all; it’s the business model, and it usually comes with far more internal mobility between functions.
The Short Version
Revenue per employee measures structure, not effort. The 15x spread between Nvidia and Walmart reflects which work each one keeps on its own payroll, and nothing about how hard anyone works.
Use it inside an industry, across several years, with revenue and headcount shown alongside it. When it moves, decompose the move before you interpret it.
And when a company’s figure improves while its revenue sits flat, the gain came out of the workforce, not out of the operating model.
FAQs
What is a good revenue per employee number?
There’s no universal benchmark, because the figure is set mostly by industry structure. The table above spans from about $340,000 per head at Walmart to roughly $5.14 million at Nvidia, and every one of those companies is considered well run. The useful question is how a company compares to its direct competitors and to its own figure three years ago.
Why do tech companies have such high revenue per employee?
Two reasons. Software revenue scales without proportional headcount, and much of the physical work in hardware businesses is contracted out to manufacturers whose employees never appear in the reporting company’s count.
Does revenue per employee measure productivity?
Not directly. It measures revenue against payroll size, and both numbers move for reasons unrelated to how productive anyone is: outsourcing, acquisitions, revenue recognition method, and layoffs all shift it. Treat it as a structural indicator that occasionally reflects productivity, not as a productivity measure.
How does automation change revenue per employee?
It raises the figure when it removes work that previously required staff, and the effect is largest in operations-heavy mid-size companies where manual processes like stock counting, reconciliation, and manual data entry occupy a meaningful share of the payroll. In very large or already-automated organizations the effect is small enough to disappear inside normal hiring noise.
Should I use revenue per employee or profit per employee?
Profit per employee is harder to game and answers the question most people are actually asking. Revenue per employee is easier to source, since revenue and headcount both appear in annual filings while segment-level profit often doesn’t. Run both when you can.
