

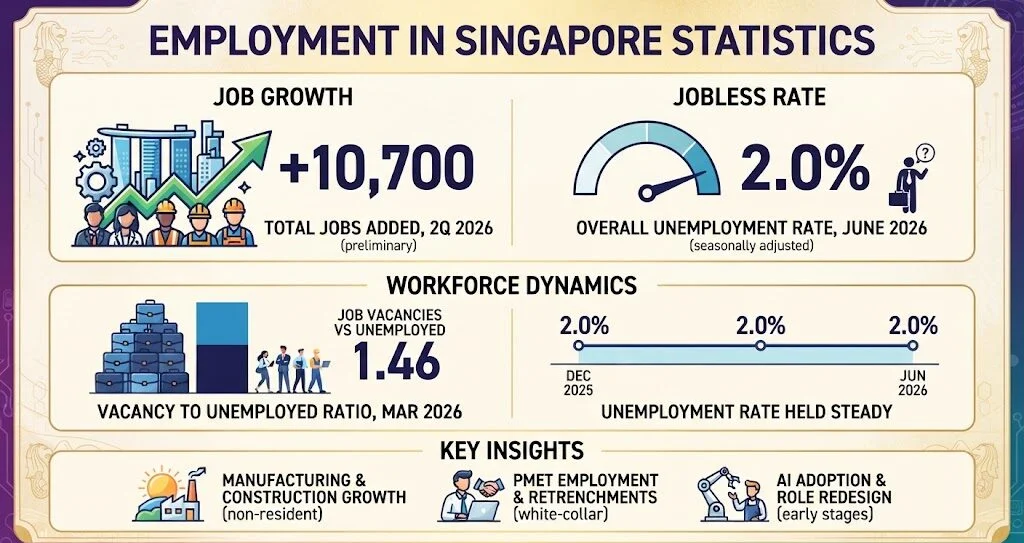
Singapore added 10,700 jobs in the second quarter of 2026 and retrenched 4,500 workers over the same three months. Both numbers come from the Ministry of Manpower’s advance release of 31 July 2026. This page sets the hiring side against the firing side, quarter by quarter, using MOM’s latest completed releases.
Employment in Singapore Statistics: The Headline Numbers
How Many Jobs Did Singapore Add in 2Q 2026?
Total employment grew by 10,700 in 2Q 2026, the 19th consecutive quarter of growth since 4Q 2021. MOM counts employment through payroll and work pass records, and the figure excludes migrant domestic workers.
The two quarters of 2026 were built differently. Residents supplied 5,400 of the 9,400 net jobs in 1Q 2026, up from 3,100 the quarter before, with gains led by Administrative & Support Services and Transportation & Storage.
In 2Q 2026 resident growth slowed and non-residents did most of the lifting, mainly in Construction and Manufacturing. MOM reported resident gains that quarter in essential and public services.
| Quarter | Total employment change | Resident employment change |
|---|---|---|
| 1Q 2025 | +2,300 | Not published |
| 2Q 2025 | +10,400 | Not published |
| 3Q 2025 | +25,100 | Not published |
| 4Q 2025 | +17,700 | +3,100 |
| 1Q 2026 | +9,400 | +5,400 |
| 2Q 2026 | +10,700 | Not published |
Source: Labour Market Report First Quarter 2026 and Labour Market Advance Release Second Quarter 2026, Manpower Research & Statistics Department, MOM. Change in persons employed at quarter end, excluding migrant domestic workers. 2Q 2026 data are preliminary. Residents are Singapore citizens and permanent residents.
The economy underneath grew 5.9% year-on-year in 2Q 2026, easing from 6.3% in 1Q 2026, and MTI raised its full-year 2026 forecast to 4.5% to 5.5% from 2.0% to 4.0% (Source: MTI, Economic Survey of Singapore Second Quarter 2026, 11 August 2026). Employment excluding migrant domestic workers stood at 3,809,500 in March 2026. The reliance on non-resident hiring separates Singapore sharply from the US employment picture, where migration plays a smaller role in quarterly job counts.
Singapore Unemployment and Job Vacancy Statistics, Dec 2025 to Jun 2026
Unemployment barely moved across six months. The overall rate held at 2.0% in December 2025, March 2026 and June 2026.
Vacancies moved instead. Openings fell from 77,700 in December 2025 to 73,300 in March 2026, and were lower than the 80,100 recorded in March 2025. MOM attributed the decline mainly to fewer non-PMET vacancies, which dropped from 36,000 to 32,100 over the quarter.
With the pool of unemployed persons flat, the ratio of job vacancies to unemployed persons fell from 1.58 in December 2025 to 1.46 in March 2026. There are still more openings advertised than people looking for work.
| Unemployment rate | Base measured | Dec 2025 | Mar 2026 | Jun 2026 |
|---|---|---|---|---|
| Overall | Total labour force | 2.0% | 2.0% | 2.0% |
| Resident | Resident labour force | 2.9% | 2.9% | 2.9% |
| Citizen | Citizen labour force | 3.0% | 3.1% | 3.0% |
| Resident long-term | Resident labour force | 0.9% | 0.9% | Not yet published |
Source: Labour Force Survey, Manpower Research & Statistics Department, MOM, December 2025 to June 2026. Rates are seasonally adjusted. Long-term unemployed refers to those unemployed for at least 25 weeks. Rates use different bases and are not shares of one whole.
Hiring sentiment turned up by mid-year. The share of firms expecting to hire in the next three months rose from 40.6% in May 2026 to 43.9% in June, the share expecting to raise wages rose from 23.7% to 29.3%, and the share expecting to retrench fell from 3.2% to 2.7%. Labour churn slowed at the same time: the average monthly resignation rate hit a historical low of 1.0% in 1Q 2026, down from 1.3%, while the recruitment rate fell from 2.0% to 1.6%.
Retrenchment Statistics in Singapore: Who Lost Jobs in 1Q 2026?
Retrenchments rose from 3,690 in 4Q 2025 to 3,830 in 1Q 2026, then to 4,500 in 2Q 2026. Incidence went from 1.6 to 1.9 retrenched per 1,000 employees over the second quarter.
MOM put the 2Q level well below downturn territory. Quarterly retrenchments ranged from 5,980 to 12,760 during the 2009 global financial crisis and from 5,640 to 9,120 during the Covid-19 pandemic.
The losses cluster at the top of the qualification ladder. Degree holders recorded the highest retrenchment incidence of any qualification group in 1Q 2026, and PMETs the highest of any occupational group. By sector, Manufacturing went from 570 to 670, Financial Services from 510 to 560, and Professional Services from 410 to 570. This concentration of white-collar losses alongside overall job growth echoes the pattern in automation and job-impact data from other markets.
| Group | Classification | 4Q 2025 | 1Q 2026 |
|---|---|---|---|
| Degree | Highest qualification | 2.6 | 3.1 |
| Diploma & professional qualification | Highest qualification | 1.8 | 1.1 |
| Below secondary | Highest qualification | 1.4 | 0.7 |
| Professionals, managers, executives & technicians | Occupation | 2.6 | 2.6 |
| Clerical, sales & service workers | Occupation | 0.7 | 0.7 |
| Production & transport operators, cleaners & labourers | Occupation | 0.4 | 0.3 |
| Aged 50 to 59 | Age | 2.8 | 3.1 |
| Aged 40 to 49 | Age | 2.5 | 2.3 |
| Aged below 30 | Age | 0.8 | 0.8 |
Source: Labour Market Survey, Manpower Research & Statistics Department, MOM, 4Q 2025 and 1Q 2026. Retrenched residents per 1,000 resident employees. Groups come from three separate classifications and do not sum.
Business reorganisation or restructuring was cited for 73.8% of 1Q 2026 retrenchments and cost-cutting for 9.3%, though firms can give more than one reason. Employers also leaned harder on reduced hours instead of layoffs: employees placed on short work-week or temporary layoff rose for a fourth straight quarter to 1,230, the highest since 4Q 2021.
How quickly do retrenched residents find work again?
The six-month re-entry rate rose for a second consecutive quarter, from 57.4% in 4Q 2025 to 60.7% in 1Q 2026. Age drives most of the spread.
Degree holders re-entered at 58.3%, up from 53.9%, still below diploma and professional qualification holders at 69.4%. Stretching the window to twelve months lifts the overall figure to 69.4%. Younger residents clearing 87.1% inside six months runs against the picture in recent graduate hiring data from the United States.
Employment in Singapore Statistics by Work Pass Type
Singapore’s total foreign workforce reached 1,635,700 in December 2025. Work Permit holders account for the bulk of it.
| Pass type | Dec 2024 | Dec 2025 |
|---|---|---|
| Employment Pass (EP) | 202,100 | 203,300 |
| S Pass | 178,200 | 178,900 |
| Work Permit (Total) | 1,165,900 | 1,222,700 |
| of which Work Permit (MDW) | 301,600 | 316,900 |
| of which Work Permit (CMP sectors) | 456,800 | 482,600 |
| Other work passes | 30,400 | 30,800 |
| Total foreign workforce | 1,576,500 | 1,635,700 |
Source: Foreign Workforce Numbers, Ministry of Manpower, as at December 2024 and December 2025. Counts are valid work pass holders. The two MDW and CMP rows are subsets of Work Permit (Total) and are not added to the total separately.
MOM uses the label “Other work passes” for Letter of Consent, pre-approved Letter of Consent, Training Work Permit and Training Employment Pass holders. Excluding migrant domestic workers, the foreign workforce was 1,318,800 in December 2025. That is why non-resident hiring in Construction and Manufacturing can move the national headline on its own.
How Is AI Changing Employment in Singapore?
MOM ran an establishment survey on AI between 19 January and 31 March 2026, covering 2,560 private sector establishments with at least 10 employees, together employing 486,600 workers. The response rate was 97.4%.
Just over seven in ten firms had not started. Among those that had, most were still planning or piloting rather than running AI inside core processes.
Adoption tracks sector and size. Information and Communications led at 74.1%, while Food and Beverage Services sat at 21.9%. Adoption also rose with headcount, from 23.9% among firms with fewer than 25 employees to 76.4% among those with more than 500. The sector split resembles what shows up in broader AI adoption at work data, where desk-based roles absorb the tools fastest.
What happened inside firms that adopted AI
Redesigning roles was roughly three times as common as cutting them. MOM asked adopters what had already happened after adoption, and firms could pick more than one outcome, so these shares do not sum to a total.
Among firms using AI, 70.7% reported higher worker productivity as the main impact on employees’ work tasks. Resident training data points the same way: 58.1% of digital skills training taken up in 2025 was AI-related, up from 39.0% in 2024, while the overall training participation rate rose from 40.7% to 54.8%. Workers watching workforce transformation trends elsewhere will recognise the shape of it.
Resident Income and Participation: Employment in Singapore Statistics for 2025
Median gross monthly income for full-time employed residents reached $5,775 in 2025, up from $5,500 in 2024, a nominal gain of 5.0%. Income at the 20th percentile went from $3,026 to $3,164, a nominal gain of 4.6%.
In real terms incomes grew 4.1% at the median and 3.6% at the 20th percentile. The P20-to-P50 ratio improved to 0.55, from 0.52 in 2020.
| Indicator | Base measured | 2024 | 2025 |
|---|---|---|---|
| Labour force participation rate | Residents aged 15 and over | 68.2% | 67.9% |
| Residents who changed jobs in the past year | Employed residents | 7.6% | 6.2% |
| Employees in permanent positions | Resident employees | Not published | 90.8% |
| PMET share of employment | Employed residents | 63.8% | 64.2% |
Source: Labour Force in Singapore 2025, Comprehensive Labour Force Survey, Manpower Research & Statistics Department, MOM, June 2025 reference period. Rows use different bases and are not shares of one whole.
Participation has fallen for four consecutive years, from 70.5% in 2021, and MOM attributes the slide to population ageing. Among residents aged 25 to 64, female participation was 80.5% in 2025 against 91.8% for men.
Job switching is the number worth watching. It fell to 6.2% in 2025, and close to six in ten full-time resident employees aged 25 to 64 who did switch saw real income increases, while 20.4% moved to lower pay. Average job tenure rose to 8.2 years, a retention pattern also visible in remote and hybrid turnover research.
One caveat applies throughout. MOM counts employment through payroll and work pass records, so own-account and platform work sits partly outside the quarterly count; the annual survey put resident platform workers at 71,600 in 2025, up from 67,200, a segment measured differently from the platform and freelance work figures published for other economies.
FAQs
How many people are employed in Singapore?
Employment excluding migrant domestic workers stood at 3,809,500 in March 2026, per MOM. Total employment then grew by 10,700 in 2Q 2026, the 19th consecutive quarter of growth since 4Q 2021.
What is Singapore’s unemployment rate in 2026?
The overall rate was 2.0% in June 2026, unchanged from March 2026 and December 2025. The resident rate was 2.9% and the citizen rate 3.0%. All figures are seasonally adjusted.
How many retrenchments were there in Singapore in 2026?
Retrenchments totalled 3,830 in 1Q 2026 and 4,500 in 2Q 2026, up from 3,690 in 4Q 2025. Incidence rose from 1.6 to 1.9 retrenched per 1,000 employees.
Are Reddit threads about Singapore layoffs a reliable guide to the data?
Reddit posts are self-selected and unweighted, so they are not a sample. MOM’s Labour Market Report is the measured source: degree holders were retrenched at 3.1 per 1,000 resident employees in 1Q 2026.
Do Reddit claims that AI is replacing Singapore jobs match MOM’s survey?
Not so far. Among surveyed firms using AI, 18.9% reported redesigning job roles and 6.2% reported reduced headcount. Reddit anecdotes carry no denominator, so they cannot be compared with survey shares.
Sources
https://www.mom.gov.sg/newsroom/press-releases/2026/0731-labour-market-advance-release-2q-2026
https://stats.mom.gov.sg/iMAS_PdfLibrary/mrsd-Labour-Market-Report-1Q-2026.pdf
