

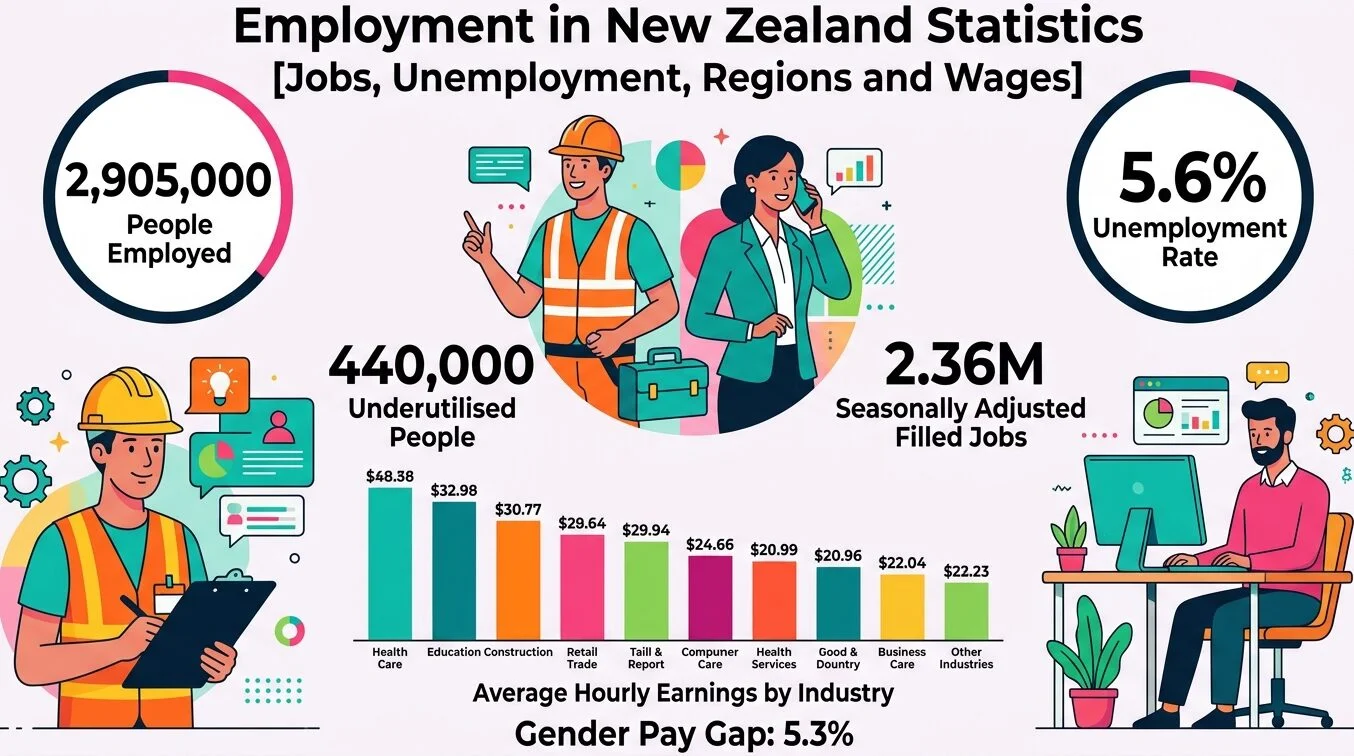
Stats NZ counted 2,905,000 employed people and 171,000 unemployed people in the June 2026 quarter, and both totals were higher than in March. This guide to employment in New Zealand statistics follows that split through the household survey, payroll filled jobs, regions, Māori and Pacific workers, wages against inflation, and SEEK job ads up to August 2026.
Employment in New Zealand Statistics
2,905,000 Employed, 171,000 Unemployed: The June 2026 Quarter
| People (seasonally adjusted) | March 2026 quarter | June 2026 quarter |
|---|---|---|
| Employed | 2,892,000 | 2,905,000 |
| Unemployed | 164,000 | 171,000 |
| Underutilised | 408,000 | 440,000 |
Source: Stats NZ, Labour market statistics: June 2026 quarter (Household Labour Force Survey, seasonally adjusted)
Employment rose 0.5% in the quarter and 1.2% on the year. The employment rate held at 66.7%, with the working-age population up 1.3% on the year to 4,353,000.
Labour force participation climbed to 70.7% from 70.4%. MBIE’s snapshot of the same survey shows the labour force up 21,000 in the quarter to 3,076,000, against a 13,000 rise in employment.
Men’s employment rate was 70.5%, against 63.1% for women. For a larger labour market measured by household survey, see these employment in the United States statistics.
The 5.6% unemployment rate compares with 5.4% in March and is the highest since the September 2015 quarter, when it was 5.7%. Westpac, the Reserve Bank and market consensus had each forecast 5.4%.
Source: Stats NZ, Labour market statistics: June 2026 quarter; MBIE, Labour Market Statistics Snapshot, June 2026; Westpac, First Impressions, 5 August 2026
Where the 440,000 Underutilised People Sit
Underutilisation adds three groups: 171,000 unemployed, 154,000 underemployed part-timers who want more hours, and 115,000 people in the potential labour force. The potential labour force rose 14,000 in the quarter.
Women accounted for 234,000 of the total and men 206,000. The underutilisation rate was 15.3% for women and 12.4% for men.
Source: Stats NZ, Household Labour Force Survey, June 2026 quarter (seasonally adjusted)
How Far Has New Zealand’s Unemployment Rate Climbed Since 2024?
The seasonally adjusted rate has not fallen in any quarter since June 2024, when it stood at 4.7%. It reached 5.6% in June 2026.
Men’s rate sat below women’s in every quarter from June 2024 to December 2025. It moved above in both 2026 quarters, reaching 5.7% against 5.5% in June.
March 2026 was first published at 5.3% and later revised to 5.4%, Westpac noted.
Of the 166,500 people unemployed in the June 2026 quarter before seasonal adjustment, 19.0% had been out of work for more than a year. That is around 8,000 more long-term unemployed people than a year earlier.
Stats NZ publishes September 2026 quarter figures on 4 November 2026.
Source: Stats NZ, Labour market statistics, June 2024 to June 2026 quarters; Westpac, NZ labour market review, Q2 2026
Employment in New Zealand Statistics From Payroll: 2.36 Million Filled Jobs
Payroll data counts filled jobs from payday filing, not people. Seasonally adjusted filled jobs rose 0.2% (5,391) in August 2026 to 2.36 million.
Goods-producing industries added 0.5% (2,008 jobs) in August, primary industries 0.5% (555) and service industries 0.2% (2,734).
Filled jobs rose in seven of the 12 months to August 2026 and fell in five. June 2026 was first published as a 0.1% rise (2,728 jobs) and now shows a 0.03% fall.
July was first reported up 0.3% and now stands at 0.24%. In actual terms, July 2026 had 2.34 million filled jobs, 18,033 (0.8%) more than July 2025.
Source: Stats NZ, Employment indicators: June, July and August 2026
Britain runs a comparable payroll count from tax records, set out in these UK employment statistics.
Industries Adding the Most Jobs, Year to June 2026
| Industry | Change in filled jobs | Percent change |
|---|---|---|
| Public administration and safety | +6,407 | +4.0% |
| Health care and social assistance | +4,986 | +1.8% |
| Education and training | +3,267 | +1.5% |
| Financial and insurance services | +2,166 | +3.0% |
| All industries | +14,327 | +0.6% |
Source: Stats NZ, Employment indicators: June 2026 (actual filled jobs, June 2026 vs June 2025)
Health care and social assistance had 287,606 filled jobs in June 2026. Stats NZ releases September 2026 payroll figures on 28 October 2026.
Source: Stats NZ, Employment indicators: June 2026 and August 2026
8.8% in Northland: Employment in New Zealand Statistics by Region
Northland recorded the highest regional unemployment rate in the June 2026 quarter at 8.8%, and its 3.4-point annual rise was the largest of the 12 regions. Canterbury and Otago shared the lowest rate, 3.6%.
| Region | Unemployment rate | Change vs June 2025 quarter | Unemployed people |
|---|---|---|---|
| Northland | 8.8% | +3.4 pts | 8,700 |
| Auckland | 6.5% | +0.4 pts | 68,000 |
| Bay of Plenty | 5.8% | +0.9 pts | 11,600 |
| Gisborne / Hawke’s Bay | 5.6% | +2.1 pts | 7,000 |
| Waikato | 5.5% | +0.1 pts | 16,200 |
| Manawatū-Whanganui | 5.3% | +0.3 pts | 7,700 |
| Wellington | 4.9% | +0.7 pts | 16,700 |
| Southland | 4.7% | +0.6 pts | 2,800 |
| Taranaki | 4.6% | +0.4 pts | 3,300 |
| Tasman / Nelson / Marlborough / West Coast | 3.7% | −0.2 pts | 4,200 |
| Canterbury | 3.6% | −1.3 pts | 14,800 |
| Otago | 3.6% | +0.6 pts | 5,600 |
Source: MBIE, Labour Market Statistics Snapshot, June 2026 (Household Labour Force Survey, not seasonally adjusted)
Canterbury and Tasman / Nelson / Marlborough / West Coast were the two regions with lower rates than a year earlier. The North Island rate was 6.0%, up from 5.3%, against 3.7% in the South Island.
Source: Stats NZ, Labour market statistics: June 2026 quarter (not seasonally adjusted)
Regional splits for another Commonwealth economy appear in these employment in Canada statistics.
Payroll Jobs by Region
Payroll counts point the same way for Canterbury and Northland. Canterbury filled jobs grew 1.9% (5,842) between June 2025 and June 2026, while Northland’s fell 2.2% (1,591).
Auckland added 0.5% (4,217) and Waikato 1.1% (2,522) over the same year.
Source: Stats NZ, Employment indicators: June 2026 (actual filled jobs)
Which Workers Face the Widest Employment Gaps in New Zealand?
| Ethnic group | Unemployment rate | Underutilisation rate |
|---|---|---|
| Pacific peoples | 11.6% | 22.1% |
| Māori | 10.8% | 22.8% |
| Asian | 5.0% | 12.5% |
| European | 4.2% | 11.8% |
Source: Stats NZ, Labour market statistics: June 2026 quarter (not seasonally adjusted)
Pacific peoples’ unemployment rate of 11.6% compares with 4.2% for Europeans. Māori underutilisation rose to 22.8% from 19.5% a year earlier, and Māori were 25.8% of all underutilised people.
Youth and Age
Unemployed 15 to 24-year-olds increased 19.5% (12,200) in the year to June 2026. Underutilisation in that age group reached 37.0%, up from 33.6%, covering 180,200 people.
For 25 to 34-year-olds, the underutilisation rate rose to 11.6% from 9.7%. MBIE’s snapshot puts the unemployment rate at 4.1% for ages 25 to 49 and 2.5% for ages 50 and over.
The seasonally adjusted NEET rate for 15 to 24-year-olds was 13.8%, down from 14.4% in March. US youth trends are tracked in these Gen Z workforce statistics.
Source: Stats NZ, Labour market statistics: June 2026 quarter; MBIE, Labour Market Statistics Snapshot, June 2026
Disabled Workers
Disabled people aged 15 to 64 had a 12.8% unemployment rate, against 5.7% for non-disabled people. Stats NZ found no statistically significant annual change in the headline rates for disabled people.
Source: Stats NZ, Labour market statistics: June 2026 quarter (not seasonally adjusted)
Wages vs Inflation in New Zealand Employment Statistics, Year to June 2026
Salary and wage rates measured by the labour cost index (LCI) rose 2.0% in the year to June 2026. Consumer prices rose 4.1% over the same year.
CPI inflation ran above LCI growth in each of the five quarters from June 2025 to June 2026. From June 2024 to March 2025, LCI growth was the higher of the two.
| Labour cost index, salary and wage rates | Annual change, year to June 2026 |
|---|---|
| All sectors | 2.0% |
| Private sector | 2.0% |
| Public sector | 1.7% |
| Unadjusted LCI | 3.1% |
Source: Stats NZ, Labour market statistics: June 2026 quarter
Average ordinary time hourly earnings reached $44.62 in the Quarterly Employment Survey (QES), up 2.8%. Private sector workers averaged $42.46 (+3.0%) and public sector workers $52.59 (+2.2%).
Source: Stats NZ, Quarterly Employment Survey, June 2026 quarter
Hourly Earnings by Industry
The QES is an employer survey that excludes self-employed people, a group covered in these freelancer statistics.
Financial and insurance services averaged $64.29 an hour in the June 2026 quarter, against $32.67 in retail trade and accommodation. The snapshot shows no figure for agriculture, forestry and fishing or for mining.
Source: MBIE, Labour Market Statistics Snapshot, June 2026 (Quarterly Employment Survey)
Gender Pay Gap: 5.3%
The gender pay gap was 5.3% in the June 2026 quarter, compared with 5.2% a year earlier. It had fallen 3.0 points in the year to June 2025.
Stats NZ calculates the gap from median hourly earnings from wages and salaries. Pay-disclosure rules aimed at gaps like this are compared in these salary transparency statistics.
| Group | Median hourly earnings | Annual change |
|---|---|---|
| Men | $36.92 | +3.6% |
| Women | $34.95 | +3.4% |
| All employees | $35.96 | +2.7% |
Source: Stats NZ, Labour market statistics (income): June 2026 quarter
Is Hiring Picking Up? SEEK Job Ads to August 2026
SEEK job ads rose 0.6% in August 2026 and stood 9.7% above a year earlier. SEEK now counts 21 consecutive months of growth after revising earlier months upward.
Its July report, published in August, had shown a third straight monthly fall before that revision.
| SEEK job ad volume, August 2026 | Change |
|---|---|
| Month on month | +0.6% |
| Quarter on quarter | +1.1% |
| Year on year | +9.7% |
Source: SEEK NZ Employment Report, August 2026 (trend series)
Applications per job ad, reported with a one-month lag, rose 0.9% in July. SEEK measures ads posted on its own platform, not total vacancies across the economy.
AI skills featured in 4.0% of job ads in August, with such mentions up 93.3% on a year earlier.
Advertised salaries on SEEK rose 2.6% in the year to August 2026. SEEK country manager Rob Clark noted this sits below annual inflation of 4.1%.
Source: SEEK NZ Employment Report and Advertised Salary Index, August 2026
FAQs
What is the unemployment rate in New Zealand in 2026?
5.6% in the June 2026 quarter, seasonally adjusted, up from 5.4% in March. That equals 171,000 unemployed people and is the highest rate since the September 2015 quarter, according to Stats NZ.
How many people are employed in New Zealand?
Stats NZ counted 2,905,000 employed people in the June 2026 quarter, an employment rate of 66.7%. Payroll data separately showed 2.36 million seasonally adjusted filled jobs in August 2026.
What is the average hourly wage in New Zealand?
Average ordinary time hourly earnings were $44.62 in the June 2026 quarter, up 2.8% on a year earlier. Median hourly earnings from wages and salaries were $35.96.
When is the next New Zealand unemployment data released?
Stats NZ releases Labour market statistics for the September 2026 quarter on 4 November 2026. Monthly employment indicators for September 2026 come first, on 28 October 2026.
Reddit users say jobs in New Zealand are hard to find. What does the data show?
Competition rose. Unemployment reached 5.6% in the June 2026 quarter, 440,000 people were underutilised, and SEEK applications per job ad rose 0.9% in July while job ads grew 9.7% year on year.
Sources
https://www.stats.govt.nz/information-releases/labour-market-statistics-june-2026-quarter/
https://www.stats.govt.nz/information-releases/labour-market-statistics-income-june-2026-quarter/
https://www.stats.govt.nz/information-releases/employment-indicators-august-2026/
https://www.mbie.govt.nz/dmsdocument/32399-labour-market-statistics-snapshot-june-2026
https://www.makerstations.io/employment-in-ireland-statistics/
