

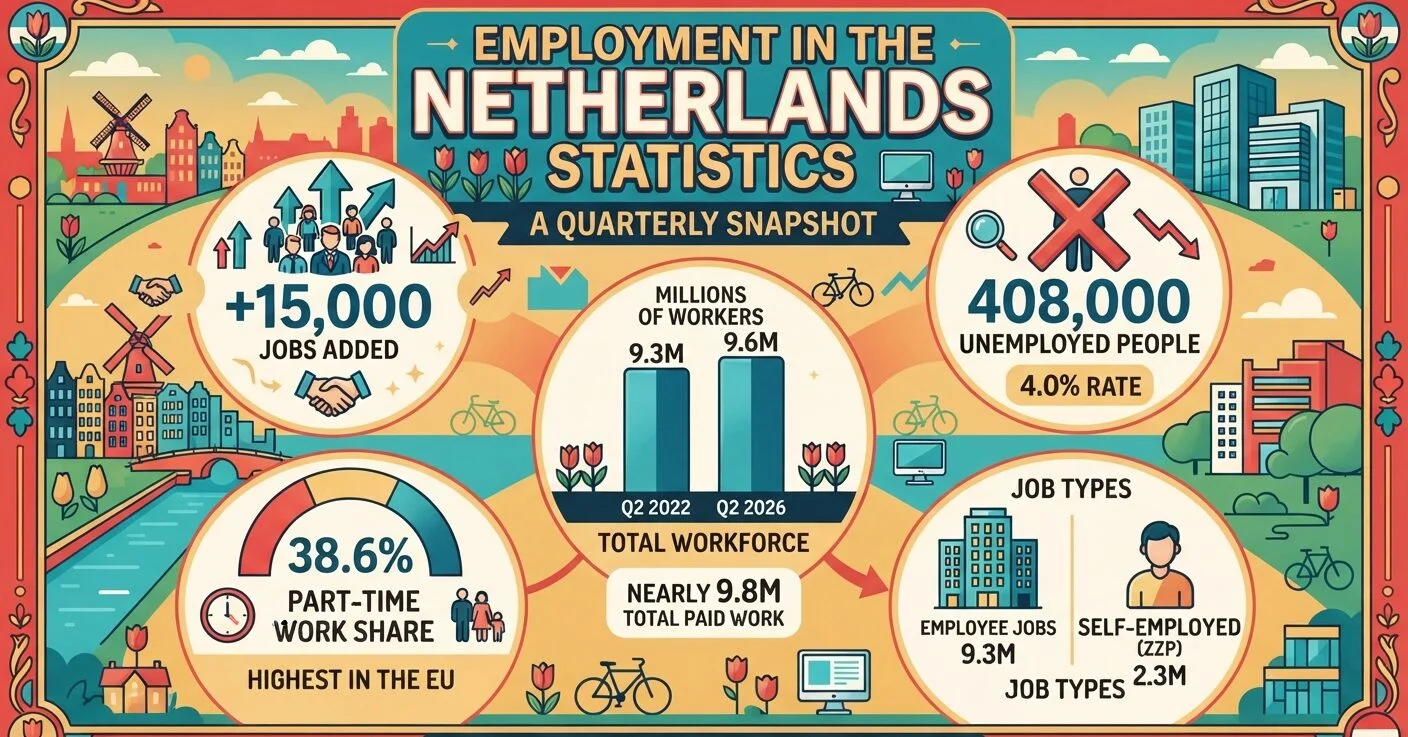
Statistics Netherlands (CBS) revised second-quarter 2026 job growth on 23 September, from a loss of 8,000 jobs to a gain of 15,000. Unemployment, meanwhile, reached 408,000 in August 2026.
This roundup of employment in Netherlands statistics covers people in work, age groups, unemployment, vacancies, CAO wages, part-time work and self-employment, using CBS and Eurostat releases published through September 2026.
Employment in Netherlands Statistics
How Many People Work in the Netherlands in 2026?
About 9.8 million people had paid work in the Netherlands in August 2026. CBS says that count has hovered near 9.8 million for almost three years.
Growth has stalled among people aged 15 to the state pension (AOW) age. That group held 9.616 million workers in Q2 2026, against 9.629 million a year earlier.
| Q2 of year | Working, 15 to AOW age (millions) | Rest of population (millions) |
|---|---|---|
| 2022 | 9.357 | 8.318 |
| 2023 | 9.539 | 8.307 |
| 2024 | 9.619 | 8.351 |
| 2025 | 9.629 | 8.443 |
| 2026 | 9.616 | 8.531 |
Source: CBS, working population and rest of population, Q2 2022 to Q2 2026
The rest of the population covers children, people of AOW age and adults without work. CBS says most of its rise to 8.531 million comes from people of state pension age.
Q2 2026 Jobs Revised From −8,000 to +15,000
The first estimate on 30 July showed 8,000 fewer jobs in Q2 2026. The second estimate, released on 23 September with revised GDP figures, shows 15,000 more jobs than in Q1 2026.
Year on year, Q2 2026 now counts 6,000 more jobs than Q2 2025. The first estimate had shown 25,000 fewer.
Source: CBS, jobs of employees and self-employed, seasonally adjusted, change on previous quarter, Q1 2024 to Q2 2026 (second estimate, provisional)
| Job type | Jobs, Q2 2026 | Change vs Q2 2025 |
|---|---|---|
| Employee jobs | 9,352,000 | +105,000 |
| Self-employed jobs | 2,353,000 | −99,000 |
| Total jobs | 11,705,000 | +6,000 |
Source: CBS, Labour market dashboard, jobs by type, Q2 2026 vs Q2 2025, not seasonally adjusted
Jobs and people are separate counts. One person can hold several jobs, and job figures cover everyone working in the Netherlands, while labour force figures cover residents.
Workers by Age: Employment in Netherlands Statistics Since 2022
Workers aged 55 to AOW age rose from 1.895 million in Q2 2022 to 2.089 million in Q2 2026. The 45 to 55 group fell from 2.003 million to 1.837 million over the same period.
CBS reports the number of working 45 to 55-year-olds has declined for nine years. Among people of AOW age, 9.5% had paid work in Q2 2026, up from 7.2% in Q2 2014.
Hours are slipping for men. Working men aged 25 to AOW age averaged 38.6 hours a week in Q2 2026, down from 39.4 four years earlier, while women in that range rose from 29.8 to 30.2 hours.
Source: CBS, employed labour force by age and average weekly hours, Q2 2022 to Q2 2026
408,000 Unemployed in August 2026
CBS counted 408,000 unemployed people in August 2026, a rate of 4.0%, unchanged from July. The count rose by an average of 3,000 a month over the three months to August.
The low point of this cycle was 343,000 in April 2023. In February 2026 the count reached 416,000, and by June it had dropped to 393,000.
| Month, 2026 | Unemployed (ILO, x 1,000) | WW benefits (x 1,000) |
|---|---|---|
| March | 407 | 201 |
| April | 397 | 198 |
| May | 399 | 196 |
| June | 393 | 195 |
| July | 404 | 194 |
| August | 408 | 195 |
Source: CBS and UWV, seasonally adjusted unemployment (15 to 75) and WW benefits, March to August 2026 (WW figures restated from January 2026)
Over the three months to August, 129,000 employed people lost their jobs and 121,000 people started looking for work. In the other direction, 142,000 unemployed people found jobs and 99,000 left the labour force.
UWV counted 194,800 WW benefits at the end of August, 0.3% more than in July. CBS corrected that change on 17 September after first publishing a 1.4% rise.
Another 3.2 million people sit outside the labour force, mostly retirees and people unable to work through illness or disability.
Source: CBS, labour market flows and UWV benefits, August 2026
Are There More Vacancies Than Unemployed People in the Netherlands?
No. CBS counted 95 vacancies per 100 unemployed people in Q2 2026, up from 91 in Q1 but below 100 for a fourth straight quarter.
Source: CBS, vacancies per 100 unemployed, seasonally adjusted, Q1 2022 to Q2 2026 (2026 provisional)
The indicator peaked at 142 in Q2 2022. For openings against job seekers in a larger economy, see these US job market figures.
Unemployment fell 17,000 to 396,000 in Q2 2026, a 3.9% rate. Vacancies fell 3,000 over the same quarter.
Open vacancies stood at 375,000 at the end of Q2 2026. Employers created 355,000 new vacancies in the quarter and filled 357,000.
The vacancy rate rose from 41 to 42 per 1,000 employee jobs. Construction stayed highest at 73, and education lowest at 18.
Source: CBS, quarterly labour market release, Q2 2026 (published 30 July 2026)
Open Vacancies by Industry, Q2 2026
Trade led with 70,500 open vacancies, followed by care at 68,500 and business services at 61,200. Those three industries hold just over half of all openings.
The 30 July first estimate also showed temporary employment agencies losing 13,000 jobs in Q2 2026, while public administration added 6,000.
Source: CBS, open vacancies and job changes by industry, seasonally adjusted, Q2 2026 (provisional)
Employment in Netherlands Statistics Across the EU, July 2026
Eurostat put Dutch unemployment at 4.0% in July 2026, level with Germany, whose workforce and jobless data show a similar rate. Czechia recorded the lowest rate in the EU at 3.3%.
| Area | July 2025 (%) | July 2026 (%) |
|---|---|---|
| Czechia | 2.8 | 3.3 |
| Poland | 3.1 | 3.4 |
| Malta | 2.5 | 3.5 |
| Netherlands | 3.8 | 4.0 |
| Germany | 3.8 | 4.0 |
| Belgium | 6.1 | 6.0 |
| EU | 6.0 | 6.1 |
| Euro area | 6.3 | 6.4 |
| France | 7.7 | 8.3 |
| Spain | 10.6 | 10.0 |
| Finland | 9.9 | 10.5 |
Source: Eurostat, seasonally adjusted unemployment rates, July 2025 and July 2026 (Netherlands, Germany and Finland: trend component)
Youth unemployment in the Netherlands was 8.6% in July 2026, against 15.1% across the EU. The same Eurostat release listed the United States at 4.1%, covered further in these US employment statistics.
CAO Wages Rose 4.3% in Q2 2026
CAO wages, set in collective labour agreements and measured per hour including special payments, rose 4.3% year on year in Q2 2026. Contractual labour costs, which add employer contributions, rose 4.2%.
Government agreements rose least at 3.4%. Private companies reached 4.5% and subsidised institutions 4.3%.
Source: CBS, CAO wage growth by sector, Q2 2026 (provisional, based on 95% of agreements)
About three in four employees fall under a CAO. For full-year 2025, CAO wages rose 5.0% on the definitive figure.
| Year | CAO wage growth per hour (%) |
|---|---|
| 2022 | 3.2 |
| 2023 | 6.1 |
| 2024 | 6.5 |
| 2025 | 5.0 |
Source: CBS, CAO wages per hour including special payments, annual change, 2022 to 2025
Information and communication led industries in 2025 at 7.4%. Real estate rental and trade was lowest at 3.2%.
Consumer prices rose 3.3% year on year in August 2026 on the CPI, up from 3.2% in July.
Source: CBS, consumer price index, July and August 2026
How Common Is Part-Time Work in the Netherlands?
Eurostat recorded 38.6% of employed people in the Netherlands working part-time in 2024, the highest share in the EU. The EU average was 17.1%.
| Country | Part-time share of employment, 2024 (%) |
|---|---|
| Netherlands | 38.6 |
| Austria | 30.7 |
| Germany | 28.9 |
| Denmark | 23.5 |
| Belgium | 23.2 |
| EU | 17.1 |
Source: Eurostat, part-time and full-time employment statistics, 2024
Eurostat bases the split on how respondents classify their own jobs. By that measure, 60.5% of employed Dutch women worked part-time.
Among employed women with children the Dutch share was 66.6%. Among men with children it was 13.7%, the top male figure in Eurostat’s EU comparison.
Many part-timers want more hours. CBS counted 568,000 underemployed part-timers in Q2 2026, up 9,000 on the quarter and 64,000 above Q3 2024.
Source: CBS, underemployed part-time workers, Q2 2026
Solo Self-Employment: The 2025 Break in Employment in Netherlands Statistics
The number of solo self-employed people, or zzp’ers, fell by 62,000 in 2025 to 1.2 million. The count covers people whose main job is self-employment without staff.
People aged 15 to 27 accounted for 19,000 of the drop, an 18% fall to 86,000. The decline among those aged 27 and older was 43,000, or 4%.
Young zzp’ers in care and welfare jobs fell from 12,000 to 7,000, the largest drop of any occupation class for workers in the Gen Z age range.
Source: CBS, zzp’ers by age and occupation, 2024 and 2025
CBS notes that stricter Tax Administration enforcement against false self-employment took effect on 1 January 2025. The fall continued into 2026: almost 1.5 million people had a self-employed main job in Q2 2026, 13,000 fewer than in Q1, all among zzp’ers.
The zzp count has fallen six quarters in a row and was 131,000 lower in Q2 2026 than in Q4 2024. The 1.5 million figure includes self-employed people with staff, so it is not a series with the 1.2 million count.
Counted by any zzp income rather than main job, CBS put the group at 1.9 million people in 2024 (provisional). Keep that measure apart from both the 1.2 million figure and broader freelancer statistics from other countries.
Source: CBS, self-employed main jobs, Q2 2026, and CBS ZZP dossier, 2024 to 2025
FAQs
How many people are employed in the Netherlands?
About 9.8 million people had paid work in August 2026, according to CBS, a level held for almost three years. Jobs are counted separately: 11,705,000 in Q2 2026, because one person can hold several jobs.
What is the unemployment rate in the Netherlands right now?
The rate was 4.0% in August 2026, or 408,000 people aged 15 to 75, unchanged from July, per CBS. Eurostat’s July 2026 figures put the euro area at 6.4% and the EU at 6.1%.
Which sectors have the most job vacancies in the Netherlands?
Trade had 70,500 open vacancies at the end of Q2 2026, care 68,500 and business services 61,200. Together they hold just over half of the 375,000 total, CBS reports.
What percentage of Dutch workers work part-time?
Eurostat recorded 38.6% of employed people in the Netherlands working part-time in 2024, the highest share in the EU. Among employed Dutch women the share was 60.5%, against 17.1% for all EU workers.
Is the Dutch job market as tough as Reddit threads suggest?
CBS data shows a looser market than in 2022, not a lack of openings. There were 95 vacancies per 100 unemployed in Q2 2026, down from 142 in Q2 2022, and unemployment was 4.0% in August 2026.
Sources
https://www.cbs.nl/nl-nl/nieuws/2026/38/iets-meer-mensen-werkloos-in-augustus
https://www.cbs.nl/nl-nl/nieuws/2026/39/economie-groeit-met-0-6-procent-in-tweede-kwartaal-2026
https://www.cbs.nl/nl-nl/nieuws/2026/31/werkloosheid-gedaald-in-tweede-kwartaal-2026
https://ec.europa.eu/eurostat/en/web/products-euro-indicators/w/3-01092026-bp
